Bitcoin (BTC/USD) Keeps Values in Rang-Bound Zones
Bitcoin Price Prediction – July 13The BTC/USD market keeps values in the range-bound zones at $35,000 and $32,500. As of writing, the crypto trades at the level of $32,936 at a positive percentage rate of around 0.05.
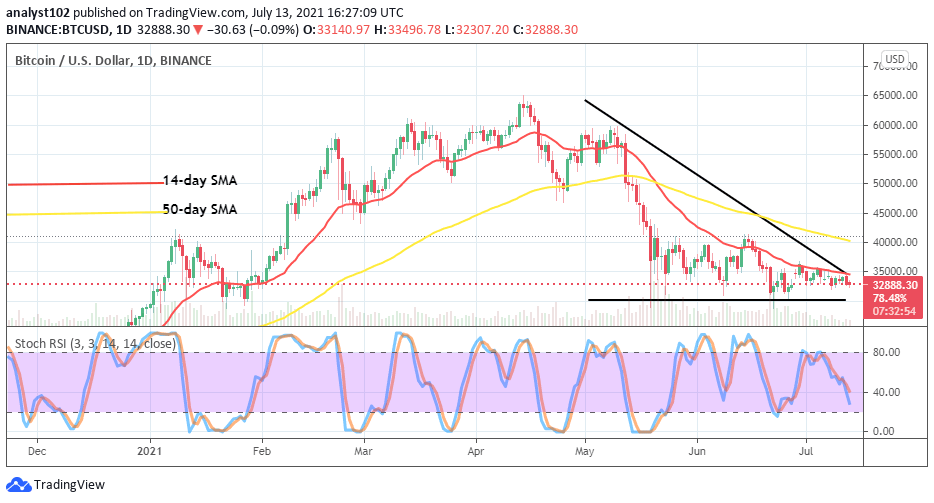
BTC/USD Market Key Levels:Resistance levels: $35,000, $37,500, $40,000Support levels: $30,000, $27,500, $25,000BTC/USD – Daily ChartOn the BTC/USD daily chart, the crypto trade keeps values in range-bound zones by continually featuring lower lows below the point of $35,000. The Stochastic Oscillators are slowly moving southbound in a slanting posture toward the range of 20 to indicate that a downward force is going on in the crypto market. The 14-day SMA is beneath the 50-day SMA as the bearish trend-line drew downward across them to place a markdown on the area of resistance trading line.
Will there soon be a change in the BTC/USD as the price keeps values in range-bound zones?
The long-kept current moving manner may still hold as the BTC/USD trade operation keeps values in range-bound zones. Being as it is, the two major market movers lacking in capacity to push the crypto trade line out of the present range-bound trading zones. Bulls may continue to look out for an entry during a reversal moving time. The market level at $30,000 remains the baseline for support.
On the downside, the BTC/USD bears still have the probable tendency to push the market down further to the immediate support level at $30,000 in the long run of gradual lowering processes. A sudden sharp breakdown of the point may in no time lead bears into a trap. Therefore, bears should be cautious, shorting positions beyond or around the support line showcased in this crypto market analytical write-up.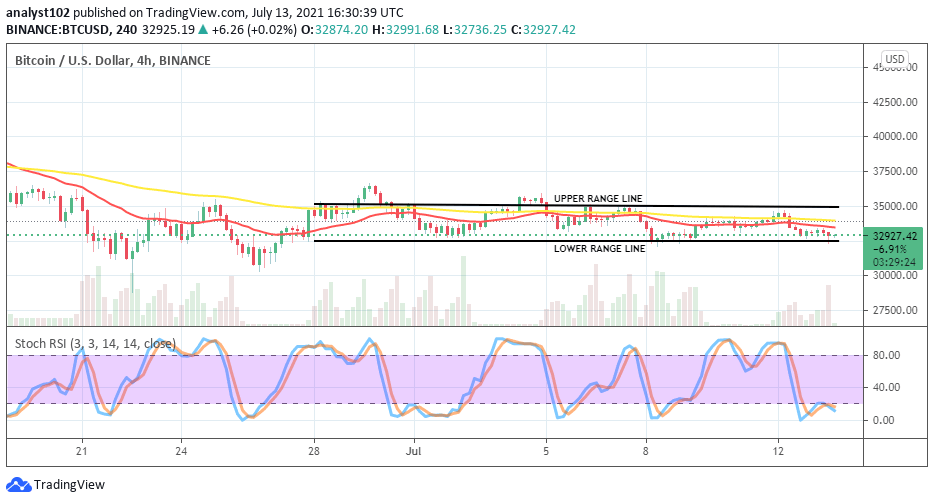

BTC/USD 4-hour Chart
The BTC/USD medium-term chart depicts that the crypto trade keeps values in range-bound zones at $35,000 and $32,500, a bit different from that of the long-term trading chart. The two SMAs closely trend toward the east direction in the range-bound zones. The 50-day SMA indicator is above the 14-day SMA indicator. The Stochastic Oscillators have conjoined the lines around the range of 20 near into the oversold region. A consolation movement of the lines around the range spot may bring about a further fall-off into the crypto economy.
Looking to buy or trade Bitcoin (BTC) now? Invest at eToro!
75% of retail investor accounts lose money when trading CFDs with this provide