
Bitcoin Price Prediction: BTC/USD Reaches $31,000 Support
Bitcoin Price Prediction – July 16
The Bitcoin price is seen declining after consolidating in a narrow channel and then buying interest may increase in the next positive direction.
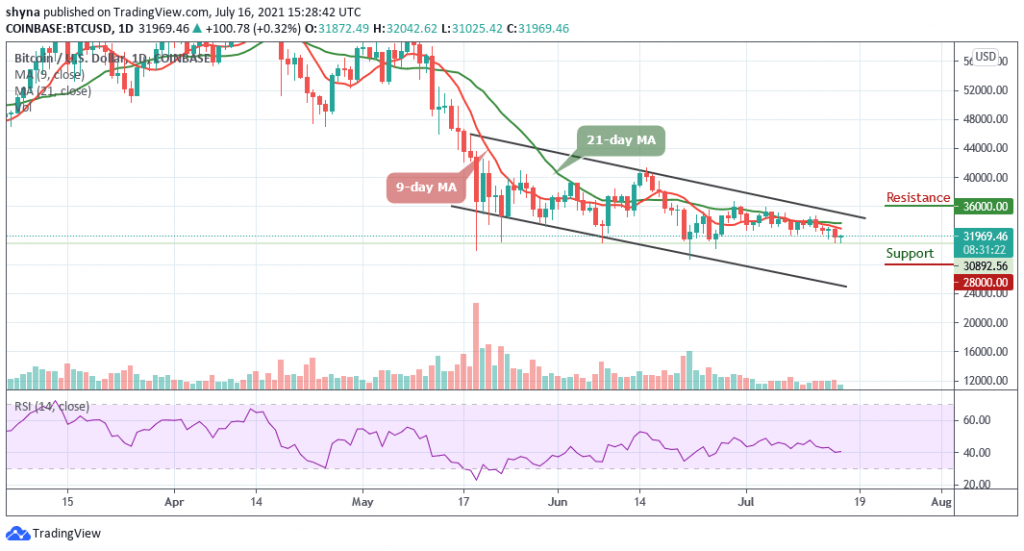
BTC/USD Long-term Trend: Bearish (Daily Chart)
Key levels:
Resistance Levels: $36,000, $38,000, $40,000

Support Levels: $28,000, $26,000, $24,000
In the early hours of today, BTC/USD touches the high of $32,259 and now retreating below $32,000 at the time of writing. BTC/USD is seen recovering slowly after a volatile start of the week but the psychological barrier of $35,000 still serves as the first important resistance within the market. However, a sustainable move above this level could push the price towards the upper boundary of the channel.
Bitcoin Price Prediction: Bitcoin Price May Follow Further Downside
On the intraday chart, the Bitcoin price prepares to break below the opening price of $31,872 which may increase the selling pressure. At the time of writing, the price is hovering at $32,089 and if this is cleared, the sell-off may be extended to $31,000 once again and the dips to $30,000 support are likely to be bought, which means the overall bullish sentiments may prevail.
Moreover, if the Bitcoin price stays below the 9-day and 21-day moving averages, $29,000 could come into focus which served as a support during the previous consolidation period while the critical supports lie at $28,000, $26,000, and $24,000. In other words, the nearest resistance may come at the $33,000 level and once it is clear, $35,000 could come back into focus. More so, further bullish movement may hit the potential resistance levels at $36,000, $38,000, and $40,000 as the technical indicator Relative Strength Index (14) moves above 40-level.
BTC/USD Medium-Term Trend: Bearish (4H Chart)
The 4-hour chart shows that the Bitcoin bears are still dominating the market pushing the price below its previous support level that existed around $32,000. Although the Bitcoin price has not yet slipped below $31,000, it’s still in the loop of making a bounce back.
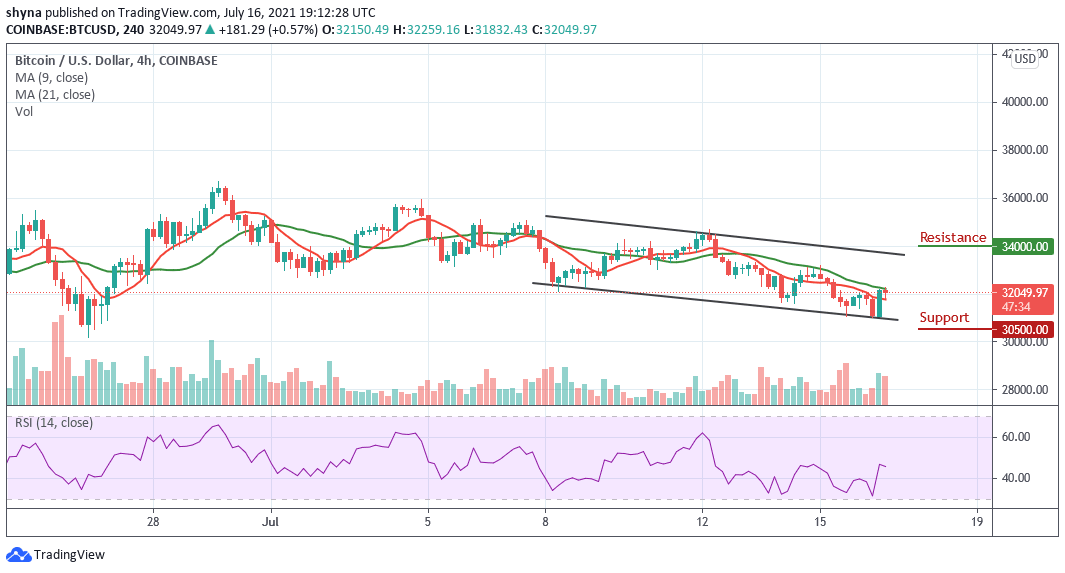
On the other hand, the Bitcoin price is currently exchanging below the 21-day MA at the time of writing this report. Therefore, the upward movement may likely push the price to the nearest resistance of $34,000 and above while the immediate support lies at $30,500 and below. The Relative Strength Index (14) is moving below the 50-level, which indicates bearish signals.
Looking to buy or trade Bitcoin (BTC) now? Invest at eToro!
75% of retail investor accounts lose money when trading CFDs with this provider