
BTC, ETH, XRP, DGB, COMP, STX, XLM — Technical Analysis July 22
Bitcoin (BTC) is following a descending resistance line.
Ethereum (ETH) and Digibyte (DGB) have made double bottom patterns.
XRP (XRP) has broken out from a descending resistance line.
Compound (COMP) has bounced at the $325 support area and broke out from a descending resistance line afterwards.

Stacks (STX) is attempting to break out from a descending resistance line.
Stellar (XLM) has broken out from a descending resistance line after creating a double bottom pattern.
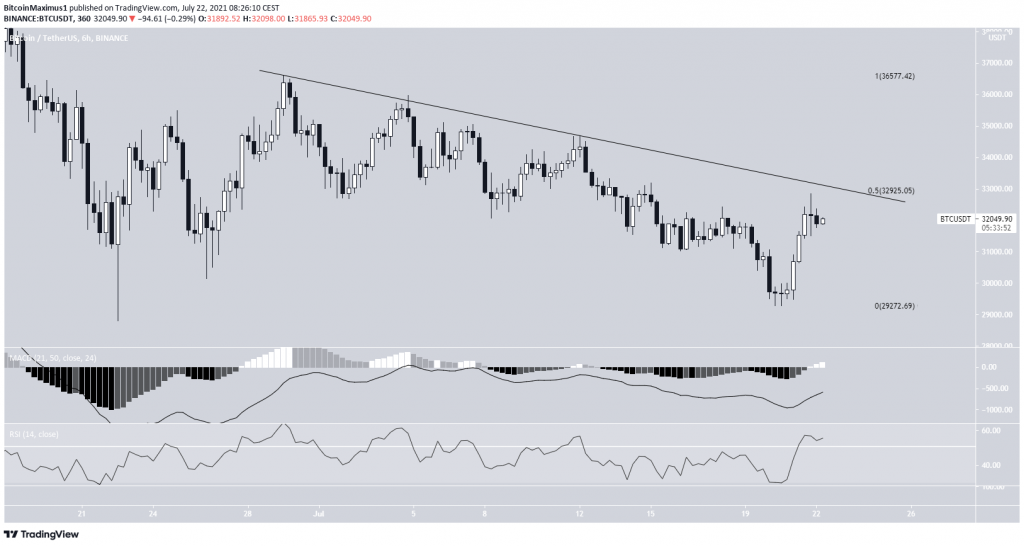
BTC
BTC has been moving downwards alongside a descending resistance line since June 29.
It reached the line for the fourth time on July 21 but was rejected. The resistance line also coincides with the $32,925 resistance area, which is the 0.5 Fib retracement resistance level.
A breakout above this level could trigger a sharp upward move.
If successful in moving above this resistance, BTC could increase towards $37,278 or $42,181.
The MACD and RSI both support the continuation of the upward movement. The MACD is nearly positive while the RSI has already moved above 50.
ETH
Similar to BTC, ETH is following a descending resistance line. It has been doing so since June 2.
On June 26 and July 20, it created a double bottom pattern near $1,720. The pattern was combined with bullish divergences in the MACD, RSI, and Stochastic oscillator. On July 21, ETH created a bullish engulfing candlestick.
The descending resistance line is currently at $2,200. A successful breakout could take ETH to the next resistance area at $2,850.

XRP
XRP has been moving downwards beneath a descending resistance line since May 20.
On June 22 and July 20, it reached lows near $0.50, creating a double bottom pattern. The pattern was combined with bullish divergence in the MACD and RSI.
After this, XRP broke out from the resistance line.
The closest resistance area is found at $0.80.
DGB
DGB reached a low of $0.031 on June 21. After a significant bounce, it returned close to the same level on July 21. This created a double bottom pattern. The pattern was combined with bullish divergence in the MACD and RSI.
DGB began an upward move after this and is currently trading close to $0.38.
The closest resistance area is found at $0.495.

COMP
COMP has been moving upwards since June 22. It reached a high of $531 on July 6 before falling. The downward move transpired under a descending resistance line.
On July 20, COMP reached a low of $318 and bounced, validating the $325 area as support. The area is also the 0.618 Fib retracement support level.
After the bounce, COMP broke out from the aforementioned descending resistance line and has been moving upwards since.
The upward move is supported by the increasing MACD and RSI.
STX
STX has been moving upwards since June 22. The upward move continued until a high of $1.47 was reached on July 11.
Since then, STX has been decreasing under a descending resistance line. On July 20, it fell to a low of $0.77 and bounced. The bounce validated the $0.80 horizontal area as support.
STX has been moving upwards since, but has been rejected by the descending resistance line and the 0.5 Fib retracement resistance level.
Both the MACD and RSI are increasing, supporting the upward movement.
A breakout above the current level could trigger a sharp increase.
XLM
On June 22, XLM reached a low of $0.20 and bounced. This led to a high of $0.293 being reached on June 29. XLM returned to the same level on July 20, creating a double bottom pattern.
The increase caused a breakout above the descending resistance line that had been in place since the June 29 high. The legitimacy of the breakout is supported by the MACD and RSI.
The closest resistance area is found at $0.285.
For BeInCrypto’s latest bitcoin (BTC) analysis, click here.
Disclaimer
All the information contained on our website is published in good faith and for general information purposes only. Any action the reader takes upon the information found on our website is strictly at their own risk.