
BTC/USD Crashes to $31,000 Support
Bitcoin Price Prediction – July 15
For the past few days now, the Bitcoin price prediction has been trading below $35,000 resistance and it may likely drop more.
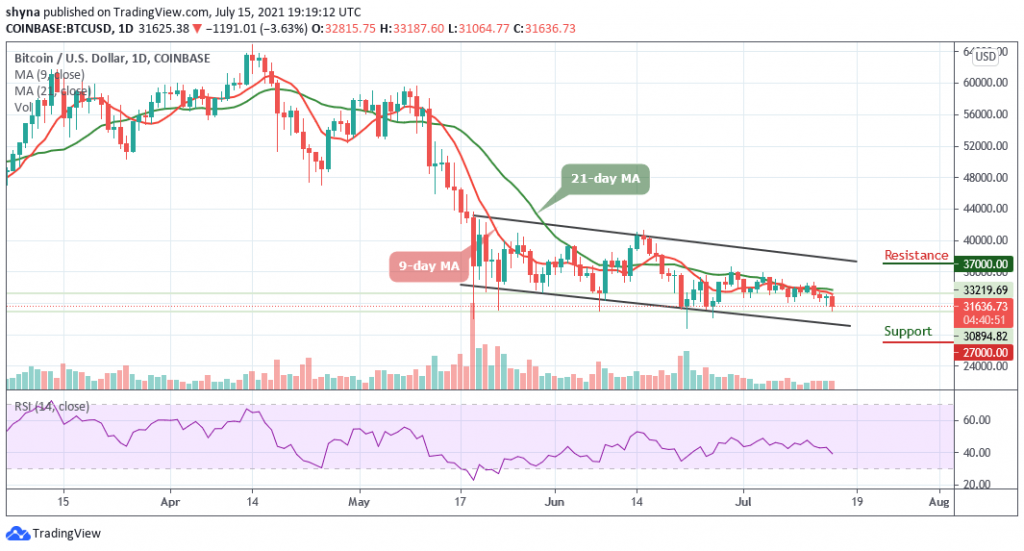
BTC/USD Long-term Trend: Bearish (Daily Chart)
Key levels:
Resistance Levels: $37,000, $39,000 $41,000
Support Levels: $27,000, $25,000, $23,000

Looking to buy or trade Bitcoin (BTC) now? Invest at eToro!
75% of retail investor accounts lose money when trading CFDs with this provider
BTC/USD crashes again trading below the $32,000 in a market-wide sell-off. The first digital asset remains below the 9-day and 21-day moving averages under increasing pressure from the bears. However, the Bitcoin price is now losing 3.63% as the market heads toward the south; the pair is being affected by the current slowdown in the entire crypto market and has been making an attempt to recover for the past few hours.
Bitcoin Price Prediction: What Could Happen to Bitcoin Price?
As of now, the Bitcoin price is aiming to fall again as the key support of $31,000 is becoming a threat to bears. However, there are quite a number of technical levels clustered above the current price which means that the coin may be vulnerable to further losses at least as long as it stays below critical $32,000. BTC/USD pair may drop to $27,000, $25,000, and $23,000 supports if the $30,000 support fails to hold.
On the contrary, if the support continues to provide support for the market, therefore, we can expect BTC/USD to come back to a resistance level of $35,000 before the market can experience a rise far above the 9-day and 31-day moving averages to reach the potential resistance levels at $37,000, $39,000, and $41,000 respectively. Looking at the daily chart, the Bitcoin price is down and there is a high tendency for a break than a bounce as the Relative Strength Index (14) moves below 40-level, a further drop may cause the price to fall more.
BTC/USD Medium-term Trend: Bearish (4H Chart)
The 4-hour chart reveals that BTC/USD is hovering below the 9-day and 21-day moving averages within descending channel. However, after touching the low of $31,064 support level, the Bitcoin price made a quick price jump towards the north, from where the bear resume pressure.
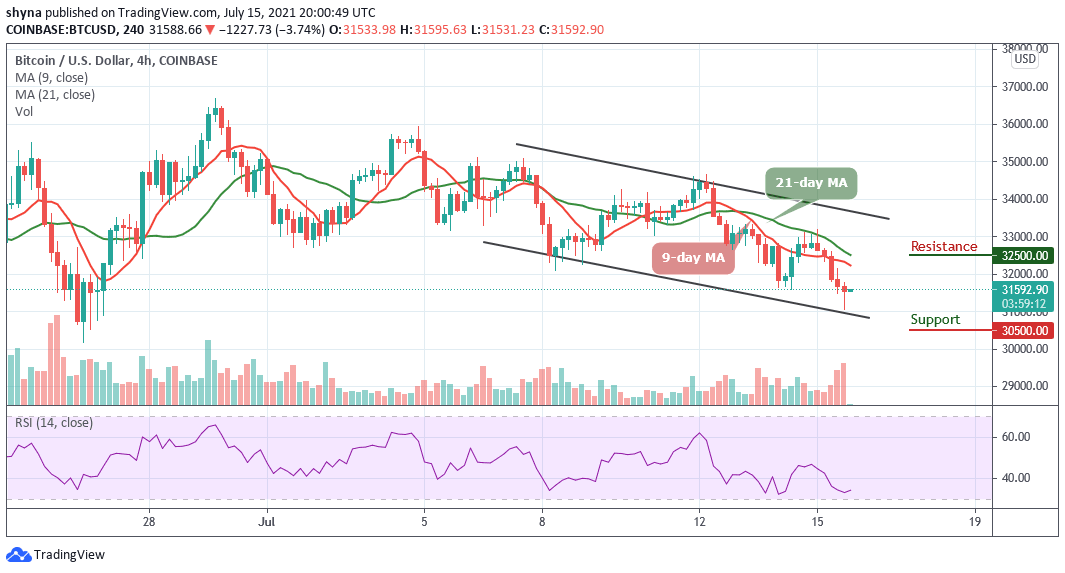
Now, the price is still trading at the $31,636 level. Once the bulls break above the 9-day and 21-day moving averages, the $37,000 and above may come into play while the support level is located at $27,000 and below. More so, the technical indicator Relative Strength Index (14) moves to cross below 40-level, which may likely continue to create a bearish play.
Looking to buy or trade Bitcoin (BTC) now? Invest at eToro!
75% of retail investor accounts lose money when trading CFDs with this provider