BTC/USD Trades below $60,000 Resistance
Bitcoin Price Prediction – November 21
After touching the daily high of $60,070, the Bitcoin price is down to touch a low of $58,509 as there may not be a quick recovery for the coin at the moment.
BTC/USD Long-term Trend: Ranging (Daily Chart)
Key levels:
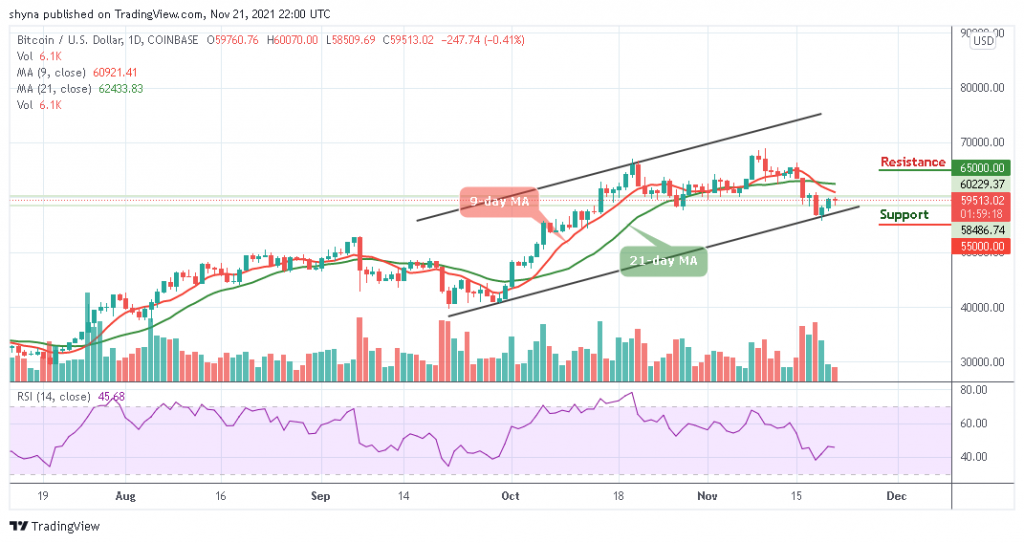
Resistance Levels: $65,000, $67,000, $69,000

Support Levels: $55,000, $53,000, $51,000
After forming a short-term top, BTC/USD is diving below $60,000 as the price is currently consolidating around $59,513 with a few bearish signals. However, the recent correction to the upward failed near the $60,070 level. The Bitcoin bulls are struggling to gain momentum above the $60,000 level.
Bitcoin Price Prediction: Would Bitcoin Go Up or Down?
As the daily chart reveals that the Bitcoin price stays below the 9-day and 21-day moving averages as the $58,000 and $56,000 levels are initial supports. Meanwhile, if the buyers fail to defend the recent low of $59,000, there is a risk of a sharp decline within the channel and if the bears drag the price below the lower boundary of the channel, the king coin could drop to the critical support levels of $55,000, $53,000 and $51,000.
However, if there is a clear break above the 9-day and 21-day moving averages, the Bitcoin price could touch the $62,000 resistance level. If the bulls manage to gain strength above this level, there are chances of a decent recovery towards the $63,000 resistance level. More so, the Bitcoin price could reach the resistance levels at $65,000, $67,000 and $69,000. Meanwhile, the Relative Strength Index (14) is moving below 45-level, suggesting a bearish signal.

BTC/USD Medium – Term Trend: Bearish (4H Chart)
On the 4-hour chart, the Bitcoin price is moving above the 9-day and 21-day moving averages, taking the price to the resistance level of $60,000. However, if the price begin to drop and move below the moving averages, it could reach the nearest support level of $57000 and below.
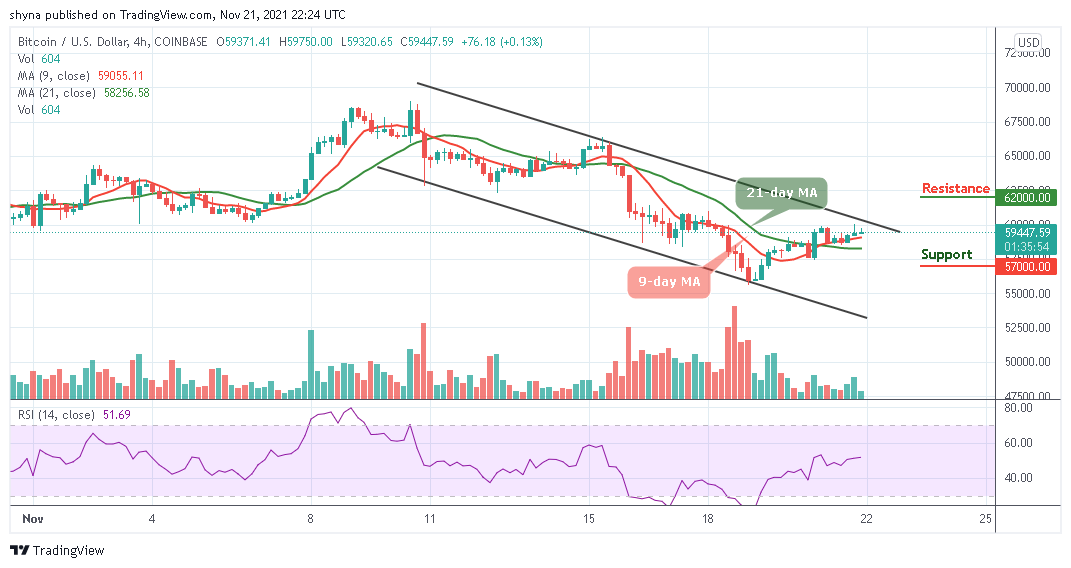
Moreover, if the bulls push the coin above the upper boundary of the channel, the Bitcoin price may likely hit the potential resistance level of $62,000, above. At the moment, the market is bearish as the Relative Strength Index (14) indicator moves around 50-level.
Looking to buy or trade Bitcoin (BTC) now? Invest at eToro!
68% of retail investor accounts lose money when trading CFDs with this provider
Read more: