
ETH price dives 4%: What next for Ethereum?

Ether’s price is down 4% and could see more losses ahead of its highly anticipated London hard fork
Ethereum is trading at around $2,484 on major exchanges, with a 24-hour negative price change of 4% from its 30-day high of $2,672.76, according to data from CoinGecko. It’s noteworthy that ETH even tested resistance near $2,700 on some exchanges, reaching $2,699 on Bitstamp.
Ethereum, like Bitcoin, is facing downward pressure as bears seek to sell at higher levels, forcing bulls to defend gains around $2,450 and $38,400 respectively. The losses across the market have seen the global crypto market cap decline 3% to currently stand at $1.62 trillion.
ETH/USD looks set to see further dips given a spike in social chatter that analytics platform Santiment says could signal a potential price flip. Ahead of Ethereum’s EIP 1559, technical analyst Michaël van de Poppe thinks the breakdown below $2,540 opens up ETH/USD to a possible downturn to lows of $2,180.

ETH/USD
The technical outlook on the 4-hour chart suggests bears present a threat, with the likely scenario being ETH revisiting lower support levels ahead of the London hard fork.
ETH/USD 4-hour chart. Source: TradingView
As seen in the above chart, Ethereum has broken below a trendline and declined to lows of $2,443. Although bulls have fought back above $2,480, they must seek further gains if they are to defend the 50 MA ($2,410) and avoid ceding fresh ground to the bears.
Looking at the technical picture we see that the 4-hour RSI is below the 50 mark, and dipping. Another technical indicator, the MACD, has formed a bearish crossover and is likely to increase into the negative zone.
The outlook gives bears the upper hand in the short term and if ETH/USD dips below the 50 MA, the next support zone would be around $2,350. If bulls fail to hold above this level, sellers will target $2,208, which is the 50% Fibonacci retracement level of the move from $1,717 to $2,699.
If the price turns lower from here, primary support would be at the psychological $2,000 line.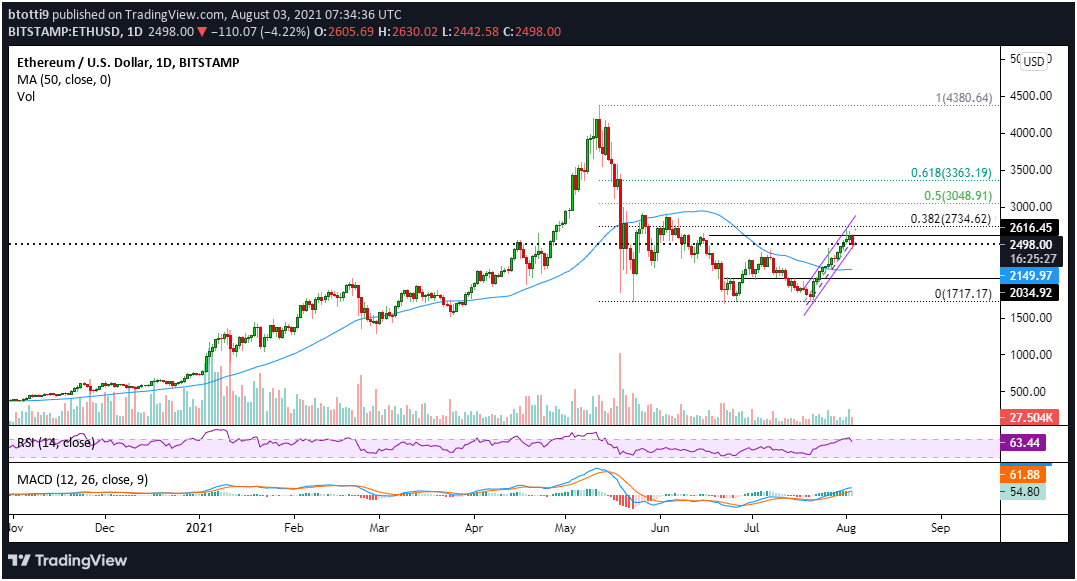
ETH/USD daily chart. Source: TradingView
On the daily chart, Ethereum price remains within an ascending parallel channel. However, the daily candle shows just how much pressure bulls have faced in the past 24 hours. Also, the RSI is above the 60 mark to suggest bulls remain in control. The daily MACD is in the bullish zone as well, indicating that the ETH/USD pair might see a fresh rally in the short term.
If the price successfully breaks above $2,500, an uptick to the $2,600 resistance line would allow bulls to target the 38.2% Fib level ($2,735) and the 50% Fib level ($3,049).