Bitcoin (BTC/USD) Trade Activity Keeps in $45,000 and $50,000
Bitcoin Price Prediction – August 17The BTC/USD trade activity keeps in $45,000 and $50,000 price levels over trading sessions. The crypto’s rate of percentage is around 1.45 to trade at a level of $47,429.
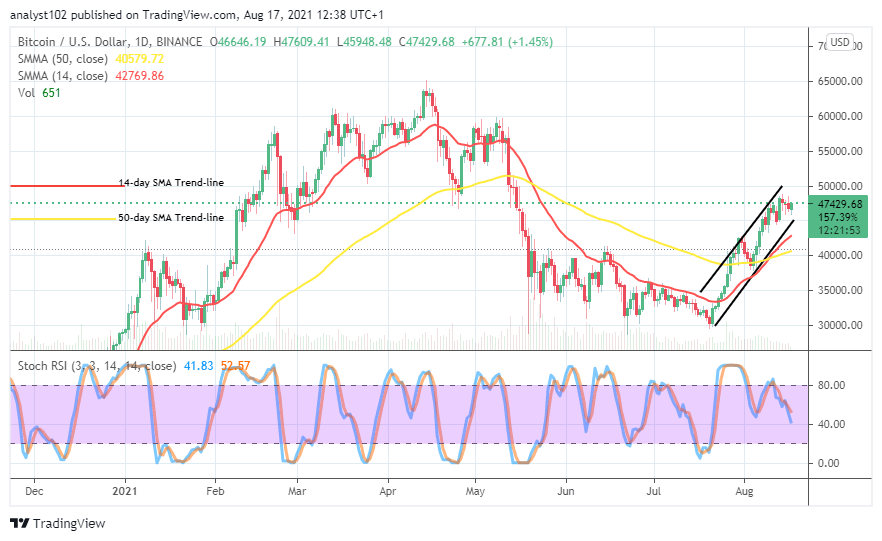
BTC/USD Market Key Levels: Resistance levels: $50,000, $52,500, $55,000Support levels: $45,000, $42,500, $40,000BTC/USD – Daily ChartThe BTC/USD daily chart showcases that the crypto trade activity keeps in $45,000 and $50,000 levels. The bullish channel lines drew still in conformity with the market’s uptrend. The interception of the bigger SMA trend-line by the smaller SMA trend-line to the north portends that some upward pressures are ongoing. The Stochastic Oscillators have slantingly drawdown from the range at 80 down near to the range 40. That indicates that the market may have to slow down the activities for a while.
Would there be a change in the present trading situation as the BTC/USD trade activity keeps in $45,000 and $50,000?
There has been no tangible signal to portend a stance of the crypto’s price, trading outside the points of $45,000 and $50,000 as the trade activity keeps in them until the present. Going by that sentiment, it is expected that price has to pull down a smaller scale to get a rebounding move. Bulls would have to be on the lookout for just that scenario to play out before considering exerting a buy order. An eventual fearful breakout of the higher figure will lead the market into other higher trading zones.
On the downside, the market value at $50,000 needed to be on the watchful area list of the crypto’s trading situation. In other words, it should be the area of consideration that price tends to witness rejection and eventually go back downward in favor of some downward trading positions. Active price motion aiming to approach the higher value mentioned so far may, in return, test the point so that the base instrument loses momentum to the US Dollar.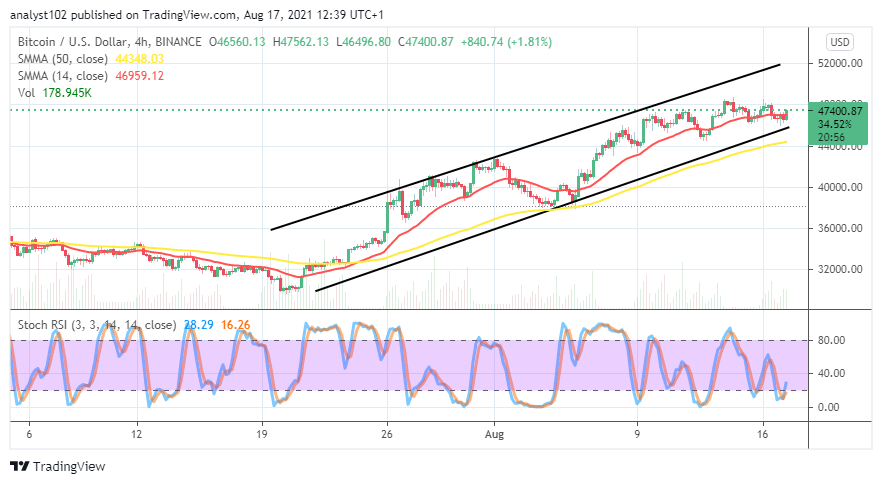 BTC/USD 4-hour ChartDespite the BTC/USD 4-hour chart showing that the crypto trade activity keeps in higher trading lines, there are some bearish candlesticks. In furtherance of taking a closer look at the market’s trend over some days’ sessions, range-bound trading zones appear in the making at around $44,000 and $48,000 levels. The 14-day SMA trend-line slightly bends southward above the 50-day SMA trend-line. The Stochastic Oscillators have briefly crossed the lines northbound against the range 20 from the oversold region.

Looking to buy or trade Bitcoin (BTC) now? Invest at eToro!
75% of retail investor accounts lose money when trading CFDs with this provide