
Bitcoin Price Prediction as $10 Billion Sends BTC Above $30,000 Resistance – New Bull Market Officially Starting?

Bitcoin, the pioneering digital asset, has once again captured global attention as it surges past the formidable $30,000 resistance level. A colossal inflow of $10 billion has catalyzed this rally, signifying renewed confidence from institutional and retail investors alike.
With this significant breach of resistance, market analysis is heralding the onset of a fresh bull market cycle. As the world keenly observes Bitcoin’s trajectory, the overarching question remains: How high will it soar this time?
Snapshot of Current Metrics
At present, Bitcoin trades at a commendable $29,623. Digital gold has seen an impressive 24-hour trading volume of approximately $21 billion, marking an upward trend of over 3% in this timeframe.
Bitcoin proudly sits at the pinnacle, dominating the crypto market, holding the #1 rank on CoinMarketCap. Its live market capitalization stands at a staggering $578 billion.

Delving into its supply metrics, there are currently 19.52 million BTC coins in circulation, inching closer to its maximum supply cap of 21 million coins.
Bitcoin Price Prediction
Analyzing the current technical landscape for Bitcoin, we find several pivotal metrics that provide insight into its potential trajectory. The pivot point, a crucial technical level, is currently placed at $29,350.
As we navigate the price landscape, Bitcoin encounters its immediate resistance at $30,285. Further resistances are sequentially layered at $31,075 and $31,820.
On the downside, the cryptocurrency has established its immediate support at $28,200. Delving deeper, subsequent support levels are discernible at $27,285 and $26,555.
Turning our focus to technical indicators, the Relative Strength Index (RSI) stands out prominently. Currently, the RSI value for Bitcoin is at 68.
This is significant as an RSI value above 70 typically signifies that the asset might be in overbought territory, suggesting a potential correction in the offing.
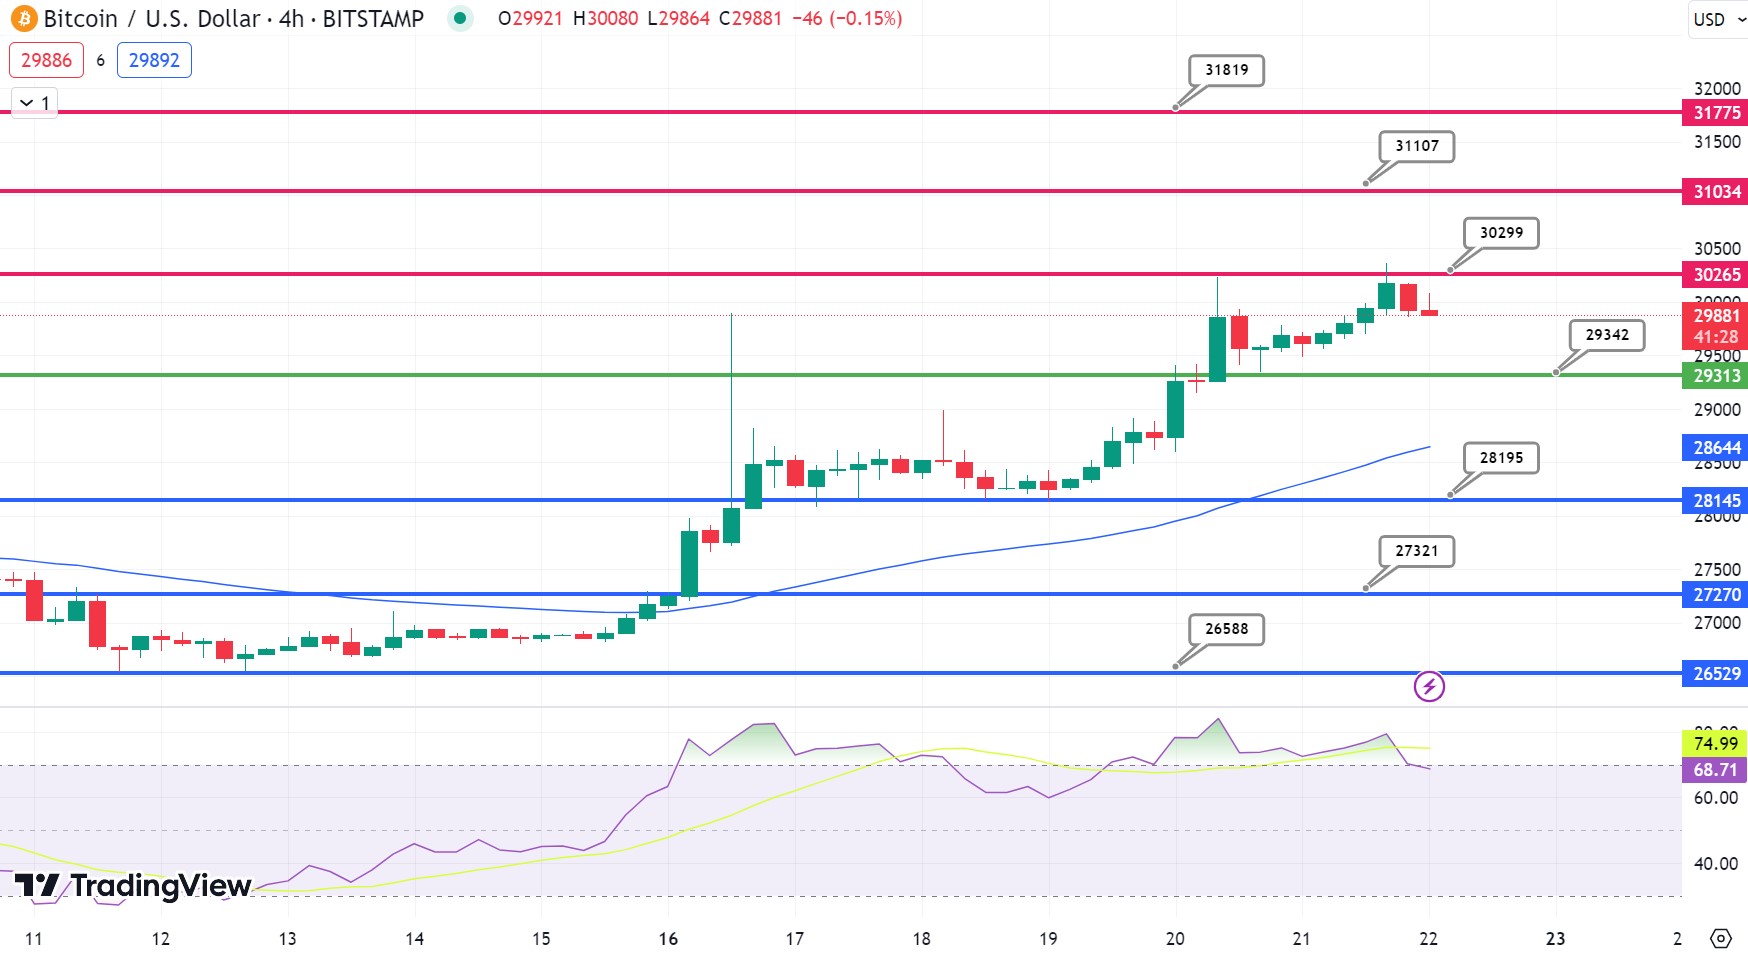
On the other end of the spectrum, an RSI below 30 would indicate an oversold condition. In Bitcoin’s case, the RSI, being just shy of 70, showcases a robust bullish sentiment.
However, traders should be on the lookout as this also implies the looming possibility of a price correction.
Further complementing our technical analysis is the 50-day Exponential Moving Average (EMA), another critical metric. For Bitcoin, this EMA is currently valued at $28,700.
This indicator, along with the aforementioned metrics, provides a comprehensive view of Bitcoin’s current market position and potential future movements.
Top 15 Cryptocurrencies to Watch in 2023
Stay up-to-date with the world of digital assets by exploring our handpicked collection of the best 15 alternative cryptocurrencies and ICO projects to keep an eye on in 2023.
Our list has been curated by professionals from Industry Talk and Cryptonews, ensuring expert advice and critical insights for your cryptocurrency investments.
Take advantage of this opportunity to discover the potential of these digital assets and keep yourself informed.
Find The Best Price to Buy/Sell Cryptocurrency
Disclaimer: Cryptocurrency projects endorsed in this article are not the financial advice of the publishing author or publication – cryptocurrencies are highly volatile investments with considerable risk, always do your own research.