BTC Attempts Positive Breakout Above $24,500
The Bitcoin price prediction reveals that BTC is moving with a tremendous buying-focused scenario capable of pushing to the upside.
Bitcoin Prediction Statistics Data:
Bitcoin price now – $24,522
Bitcoin market cap – $468.2 billion
Bitcoin circulating supply – 19.1 million
Bitcoin total supply – 19.1 million
Bitcoin Coinmarketcap ranking – #1
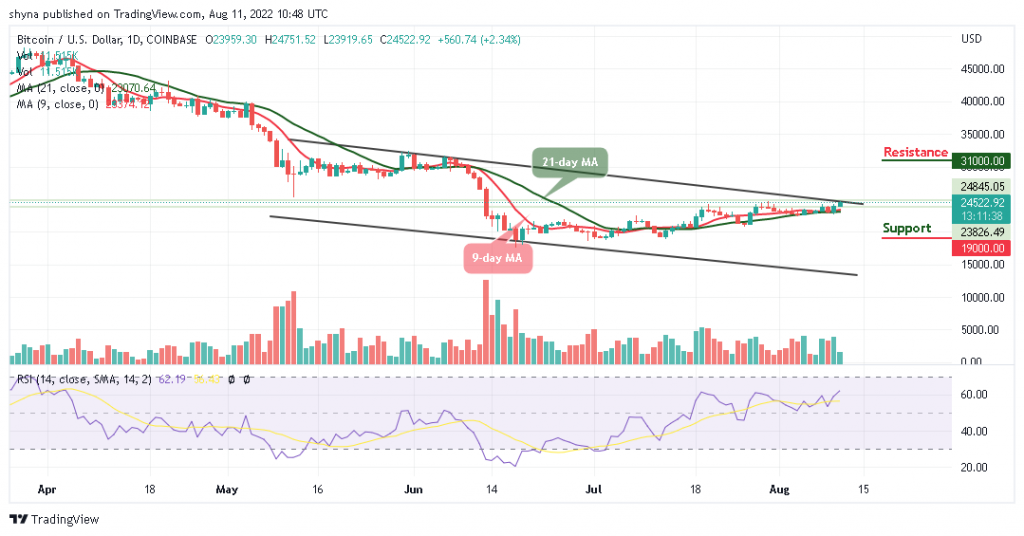
BTC/USD Long-term Trend: Ranging (Daily Chart)
Key levels:

Resistance Levels: $31,000, $33,000, $35,000
Support Levels: $19,000, $17,000, $15,000
Buy Bitcoin Now
Your capital is at risk.
BTC/USD is at the moment trading at $24,522 with a 2.34% gain. However, there has been a huge spike in the last five trading days, which could turn the scenario towards uptrend momentum only after the Bitcoin price surpasses the resistance level of $24,000 without retracements. Breaching this level would put BTC above the potential resistance level of $25,000, indicating a higher upside potential and bringing more buyers to the fold.
Bitcoin Price Prediction: Would BTC Price Break Higher?
The Bitcoin price has seen some turbulent times struggling to surpass $22000 for the last two months. Technicals are now bullish, with strong green candles moving to cross above the upper boundary of the channel. The Relative Strength Index (14) indicator showcases an ongoing rally and also creates a bullish scenario as the signal line crosses above the 60-level.
Moreover, the short-term outlook is positive for the king coin, with a potential for some retracement before the bullish continual. Any further bullish movement could locate the resistance levels of $31,000, $33,000, and $35,000 while the supports can be found at $19,000, $17,000, and $15,000.
BTC/USD Medium-term Trend: Ranging (4H Chart)
On the 4-hour chart, the technical indicator Relative Strength Index (14) is recovering towards the 70-level, and this may confirm the bullish movement if it crosses above it. Meanwhile, adding to the above, there is a little bit of bullish divergence on the RSI (14) as the coin moves to touch the resistance level of $25,000.
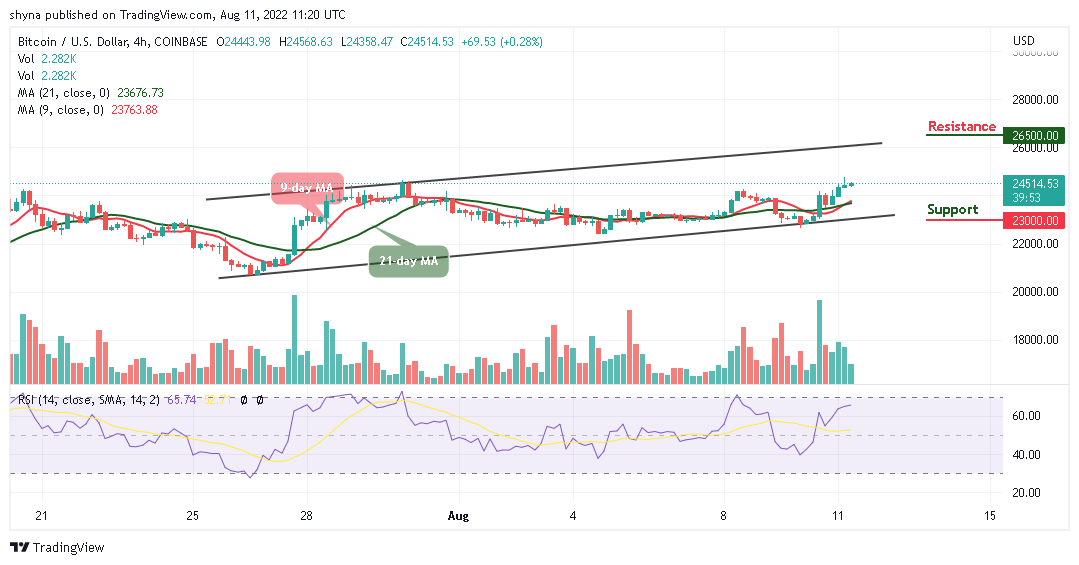
On the contrary, if the Bitcoin price breaks below the 9-day and 21-day moving averages, the market price likely hit support at $23,000 and below. Meanwhile, if the current market value rises and crosses above $25k resistance, it may reach the resistance level at $26,500 and above.
Related
How to Buy Tamadoge
Visit Tamadoge Website
Tamadoge – Play to Earn Meme Coin

Earn TAMA in Battles With Doge Pets
Capped Supply of 2 Bn, Token Burn
NFT-Based Metaverse Game
Presale Live Now – tamadoge.io