
BTC/USD Bears Could Demolish $19,000 Support
Join Our Telegram channel to stay up to date on breaking news coverage
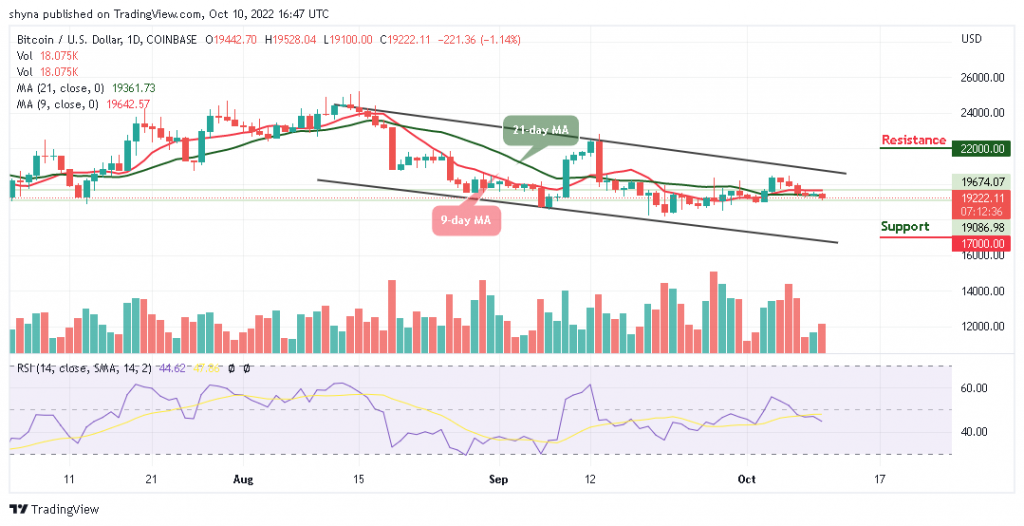
The Bitcoin price prediction shows that BTC keeps trading below the moving averages as the coin touches $19,100 support.
Bitcoin Prediction Statistics Data:
Bitcoin price now – $19,222
Bitcoin market cap – $368.6 billion
Bitcoin circulating supply – 19.1 million
Bitcoin total supply – 19.1 million
Bitcoin Coinmarketcap ranking – #1
BTC/USD Long-term Trend: Bearish (Daily Chart)
Key levels:

Resistance Levels: $22,000, $24,000 $26,000
Support Levels: $17,000, $15,000, $13,000
Buy Bitcoin Now
Your capital is at risk
BTC/USD is currently facing a setback as this could be a permanent one as revealed by the daily chart. The king coin is likely to have a bearish run in the short term as a price rally may help the coin to head to the south. Currently, Bitcoin (BTC) is trading around the $19,222 level after a free fall from $19,528 during the European session and the coin has shown tremendous volatility over the past few days.
Bitcoin Price Prediction: Bitcoin (BTC) May Head Below the Moving Averages
Looking at the daily chart, the Bitcoin price is currently nose-diving below the 9-day and 21-day moving averages. If the price should slump below the support level of $19,000, the king coin is likely to face a downward trend. However, the further bearish movement could locate the supports at $17,000, $15,000, and $13,000, making room for BTC to fall even further.
In the meantime, the technical indicator Relative Strength Index (14) is likely to cross below the 50-level as the trading volume could be in support of the bears. Moreover, if the buyers decide to push the price above the upper boundary of the channel, BTC/USD may locate the potential resistance levels at $22,000, $24,000, and $26,000.
BTC/USD Medium-term Trend: Ranging (4H Chart)
On the 4-Hour chart, the Bitcoin price stays below the 9-day and 21-day moving averages, and the nearest support is likely to come at the $19,000 level. The price may likely fall below the lower boundary of the channel if the bears fully stepped back into the market.
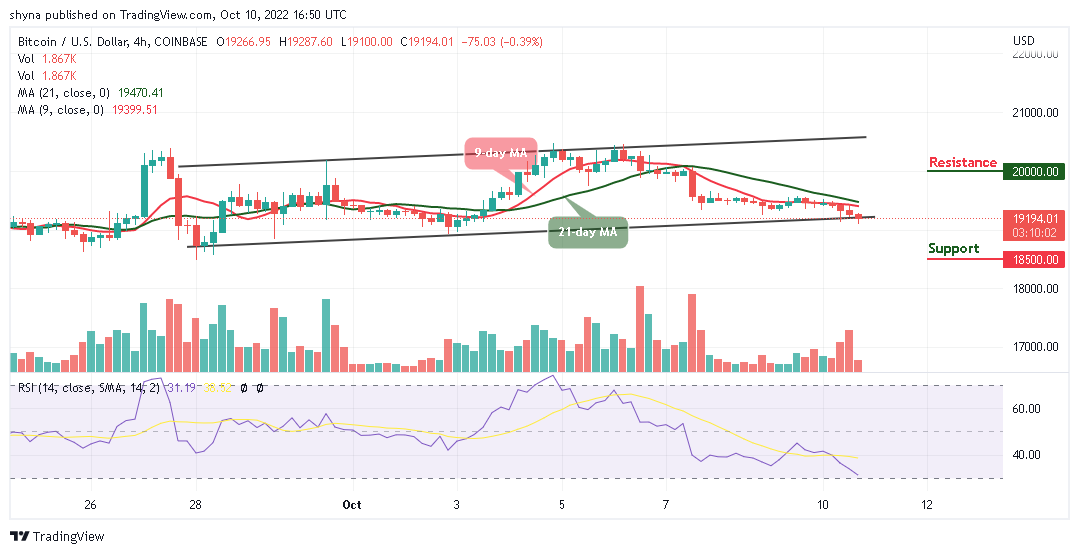
However, a further bearish movement could test the critical support at $18,500 and below while the resistance is located above the moving averages at the resistance level of $20,000 and above. Technically, Bitcoin is currently moving into the negative side while the technical indicator Relative Strength Index (14) moves into the oversold region, which indicates that the market will retain the bearish trend.
Tamadoge – Play to Earn Meme Coin

Earn TAMA in Battles With Doge Pets
Maximum Supply of 2 Bn, Token Burn
Now Listed on OKX, Bitmart, Uniswap
Upcoming Listings on LBank, MEXC
Join Our Telegram channel to stay up to date on breaking news coverage