
Chainlink Approaches Significant Supply Wall

Key Takeaways
Chainlink gained over $0.50 in Friday’s trading session.
As bullish pressure rises, LINK could gain enough momentum to advance to $10.
Nonetheless, several indicators suggest that LINK could soon face a correction.
Share this article
Chainlink has seen a significant increase in bullish momentum, currently leading the cryptocurrency market. Still, multiple indicators suggest that LINK could experience a brief correction if it enters the $10 zone.
Chainlink Approaches Double-Digit Territory
Chainlink has outperformed the top 10 cryptocurrencies by market capitalization, surging more than 6% since the start of Friday’s trading session.
LINK rallied from a low of $8.97 to an intraday high of $9.50, before cooling to $9.21 at press time. As upward pressure continues to mount, the token appears to have more room to ascend. The development of a descending triangle on the daily chart suggests that Chainlink could rise another 11% before its uptrend reaches exhaustion.

The Y-axis of this technical formation projects a $10.60 target for LINK since it overcame the $7.30 resistance level on July 29. Although the rest of the cryptocurrency market has shown signs of weakness, it appears that Chainlink could achieve its upside potential from a technical perspective.
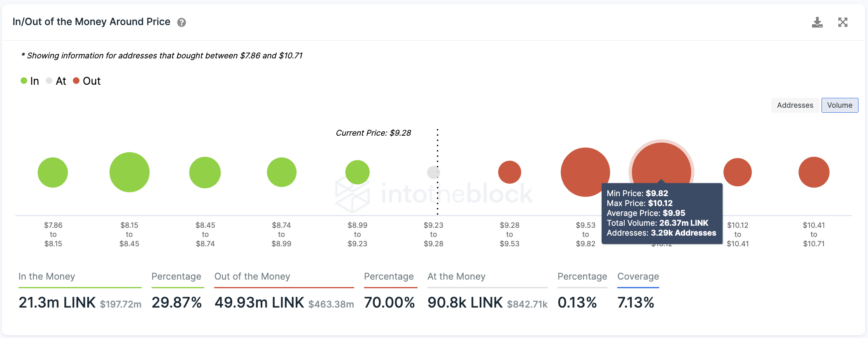
Still, IntoTheBlock’s In/Out of the Money Around Price model shows a stiff supply barrier ahead. Roughly 3,300 addresses have previously purchased nearly 26.4 million LINK between $9.82 and $10.12. This significant area of interest could reject the upward price action as underwater investors could attempt to break even on some of their holdings.
Although LINK may have the strength to hit double-digit territory, Chainlink is approaching a significant area of resistance. The Tom DeMark (TD) Sequential indicator also has a high probability of presenting a sell signal on LINK’s daily chart. The potential bearish formation could lead to a one to four daily candlesticks correction before the uptrend resumes.
Disclosure: At the time of writing, the author of this piece owned BTC and ETH.
For more key market trends, subscribe to our YouTube channel and get weekly updates from our lead bitcoin analyst Nathan Batchelor.
Share this article
The information on or accessed through this website is obtained from independent sources we believe to be accurate and reliable, but Decentral Media, Inc. makes no representation or warranty as to the timeliness, completeness, or accuracy of any information on or accessed through this website. Decentral Media, Inc. is not an investment advisor. We do not give personalized investment advice or other financial advice. The information on this website is subject to change without notice. Some or all of the information on this website may become outdated, or it may be or become incomplete or inaccurate. We may, but are not obligated to, update any outdated, incomplete, or inaccurate information.
You should never make an investment decision on an ICO, IEO, or other investment based on the information on this website, and you should never interpret or otherwise rely on any of the information on this website as investment advice. We strongly recommend that you consult a licensed investment advisor or other qualified financial professional if you are seeking investment advice on an ICO, IEO, or other investment. We do not accept compensation in any form for analyzing or reporting on any ICO, IEO, cryptocurrency, currency, tokenized sales, securities, or commodities.
See full terms and conditions.