
Ripple (XRP) Price Correction: How Long Will the Downtrend Last?

The XRP price continues to undergo a corrective phase. Investors are eager to know if Ripple’s price will soon rebound to resume its upward trajectory.
Over the past day, Ripple’s price has once again experienced a decline. This raises questions about when the corrective phase for Ripple will come to an end.
XRP Price Hurdle: Rejected Bearishly at $0.632 Fib Resistance
In the past seven days, the XRP price has partially recovered from its correction. However, as of yesterday, Ripple’s price trajectory has again turned downward.
The recent downturn occurred after Ripple faced bearish rejection at the 0.382 Fibonacci resistance level, approximately $0.632. Consequently, Ripple may now revisit the golden ratio support around $0.52.

Despite this setback, the daily chart suggests a more bullish outlook. The Moving Average Convergence Divergence (MACD) histogram shows an upward trend, and there’s a potential for bullish crossover in the MACD lines.
Moreover, the Relative Strength Index (RSI) is currently in neutral territory, indicating a lack of clear bullish or bearish signals at the moment.
Read More: How To Buy XRP and Everything You Need To Know
Bearish Ahead? Ripple’s 4-Hour Chart Indicators Turn Negative
In the 4-hour chart, there are indications of potential bearish momentum. The MACD lines are on the verge of crossing into bearish territory, and the MACD histogram shows a downward trend.
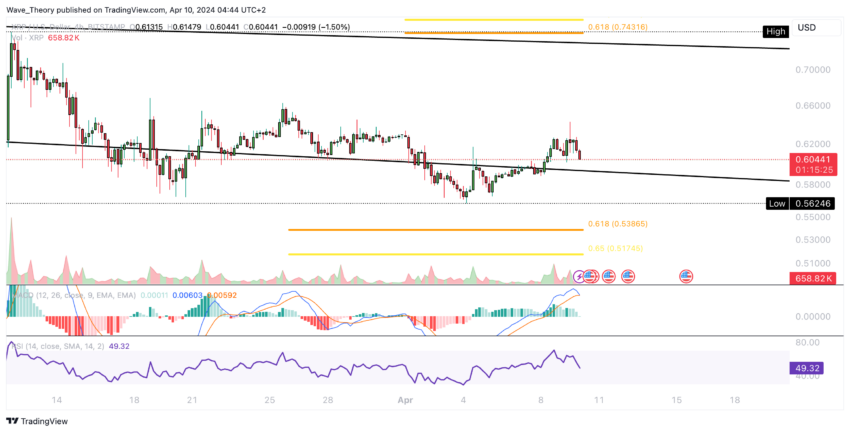
At the same time, the RSI is hovering in neutral territory, providing no clear signals of bullish or bearish momentum.
MACD Indicator Signals Bearish Development
In the weekly chart, there are bearish indications as the MACD histogram has been trending downward since the previous week. This suggests the possibility of the MACD lines crossing into bearish territory soon.
Meanwhile, the RSI remains neutral, offering no clear directional signals. The crucial factor for Ripple’s future trajectory lies in the fact that the golden ratio level is first breached.
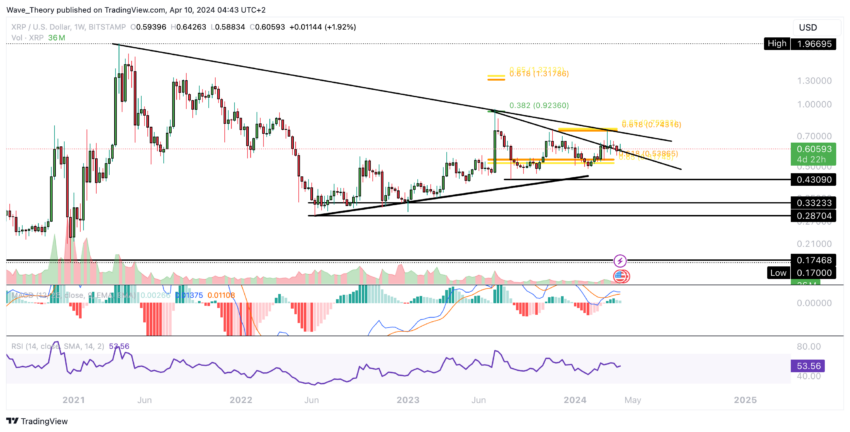
To the upside, the golden ratio resistance at approximately $0.75 poses significant barriers. Conversely, the golden ratio support at around $0.53 serves as a crucial level of support.
Should this support level be breached, the next significant support for the Ripple price is anticipated at around $0.43.
Will the Price Correction Extend Through the Month?
The monthly chart indicates a potential bearish trend emerging as the MACD histogram begins to trend lower in a bearish manner for the current month. This suggests the likelihood of a bearish April, characterized by a continuation of the ongoing correction in the XRP price.
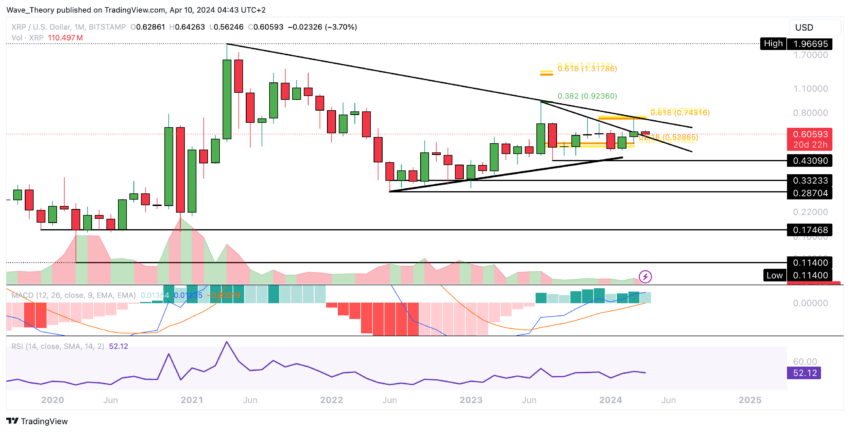
Despite this, the MACD lines remain crossed in a bullish manner, indicating ongoing positive momentum, while the RSI remains neutral, offering no clear directional cues.
Read More: Ripple (XRP) Price Prediction 2024/2025/2030
XRP Versus Bitcoin: The Ongoing Price Decline
The Ripple price is experiencing a notable downward trend against Bitcoin (BTC), with a critical support level identified around 0.0000062 BTC.
Additionally, the bearishly crossed MACD lines in the weekly chart indicate a sustained bearish trajectory. However, a bullish trend is observed in the MACD histogram, while the RSI is currently in oversold territory.
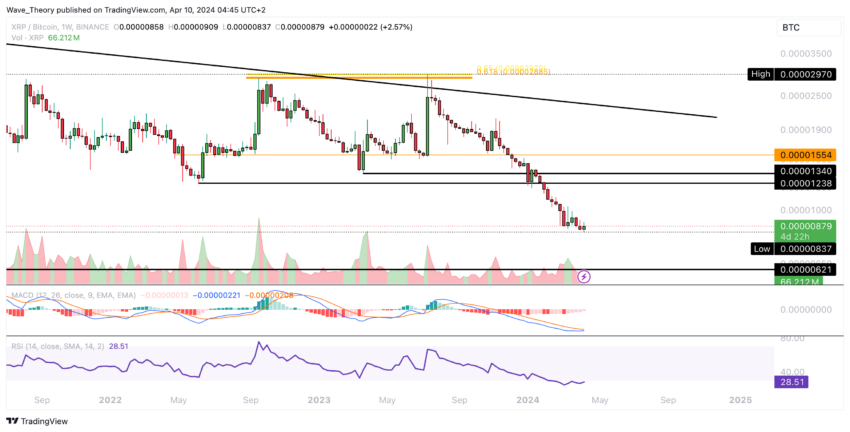
On the upside, Ripple faces significant resistance from approximately 0.0000124 BTC to 0.0000134 BTC.
The post Ripple (XRP) Price Correction: How Long Will the Downtrend Last? appeared first on BeInCrypto.