Why CHZ, RVN, LDO, XLM And ATOM Are Dropping Like Flies

Be[in]Crypto takes a look at the five cryptocurrencies that dumped the most last week, more specifically, from Sept. 23 to Sept. 30.
These cryptocurrencies are:
Chiliz (CHZ): -11.69%Ravencoin (RVN): -8.04%Lido DAO (LDO): -7.73%Stellar (XLM): -6.18%Cosmos (ATOM): -5.98%
CHZ completes five-wave move up
CHZ has been moving upwards since reaching a low of $0.081 on June 18. The upward movement has led to a high of $0.282 on Sept. 23. The entire increase looks like a completed five-wave move, so a significant correction seems likely. Moreover, the high was made at the 0.618 length of waves 1-3 (white).

If a correction has begun, CHZ is currently in the A wave of an A-B-C structure. The entire correction could end between the 0.5-0.618 Fib retracement support levels at $0.158 – $0.181.
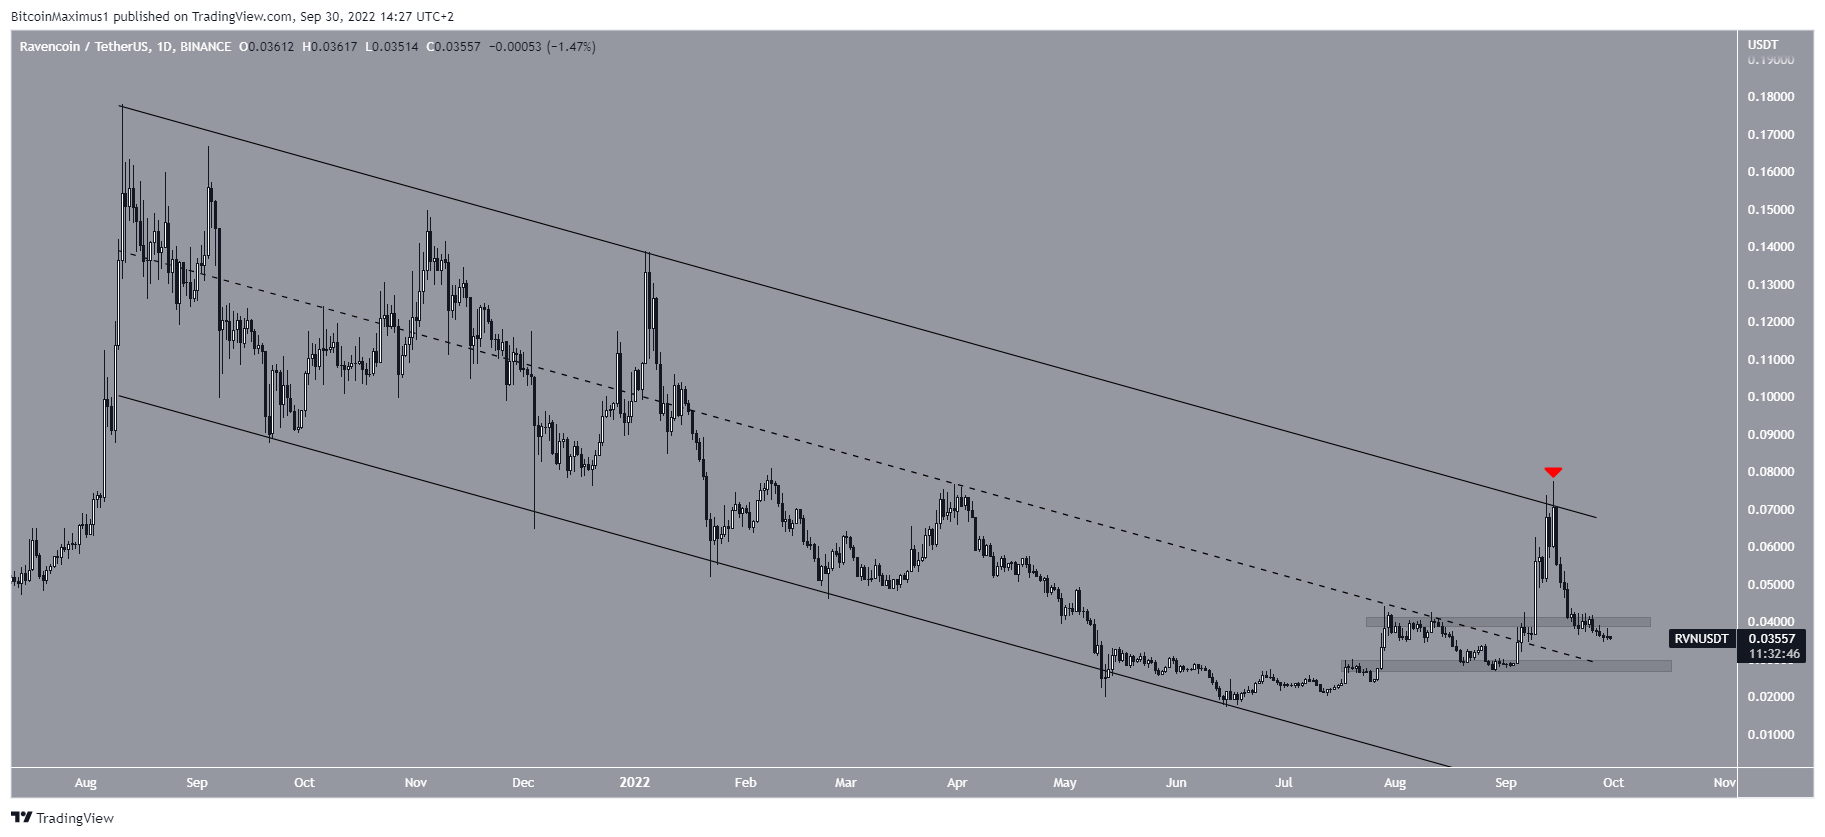
RVN resumes fall after being rejected
RVN has been decreasing since it was rejected by the resistance line of a long-term descending parallel channel on Sept. 14 (red icon). The downward movement has so far led to a low of $0.034, which was reached on Sept. 28.
The decrease has also caused a breakdown below the $0.04 horizontal area. If the downward movement continues, the next closest support area would be at $0.027.
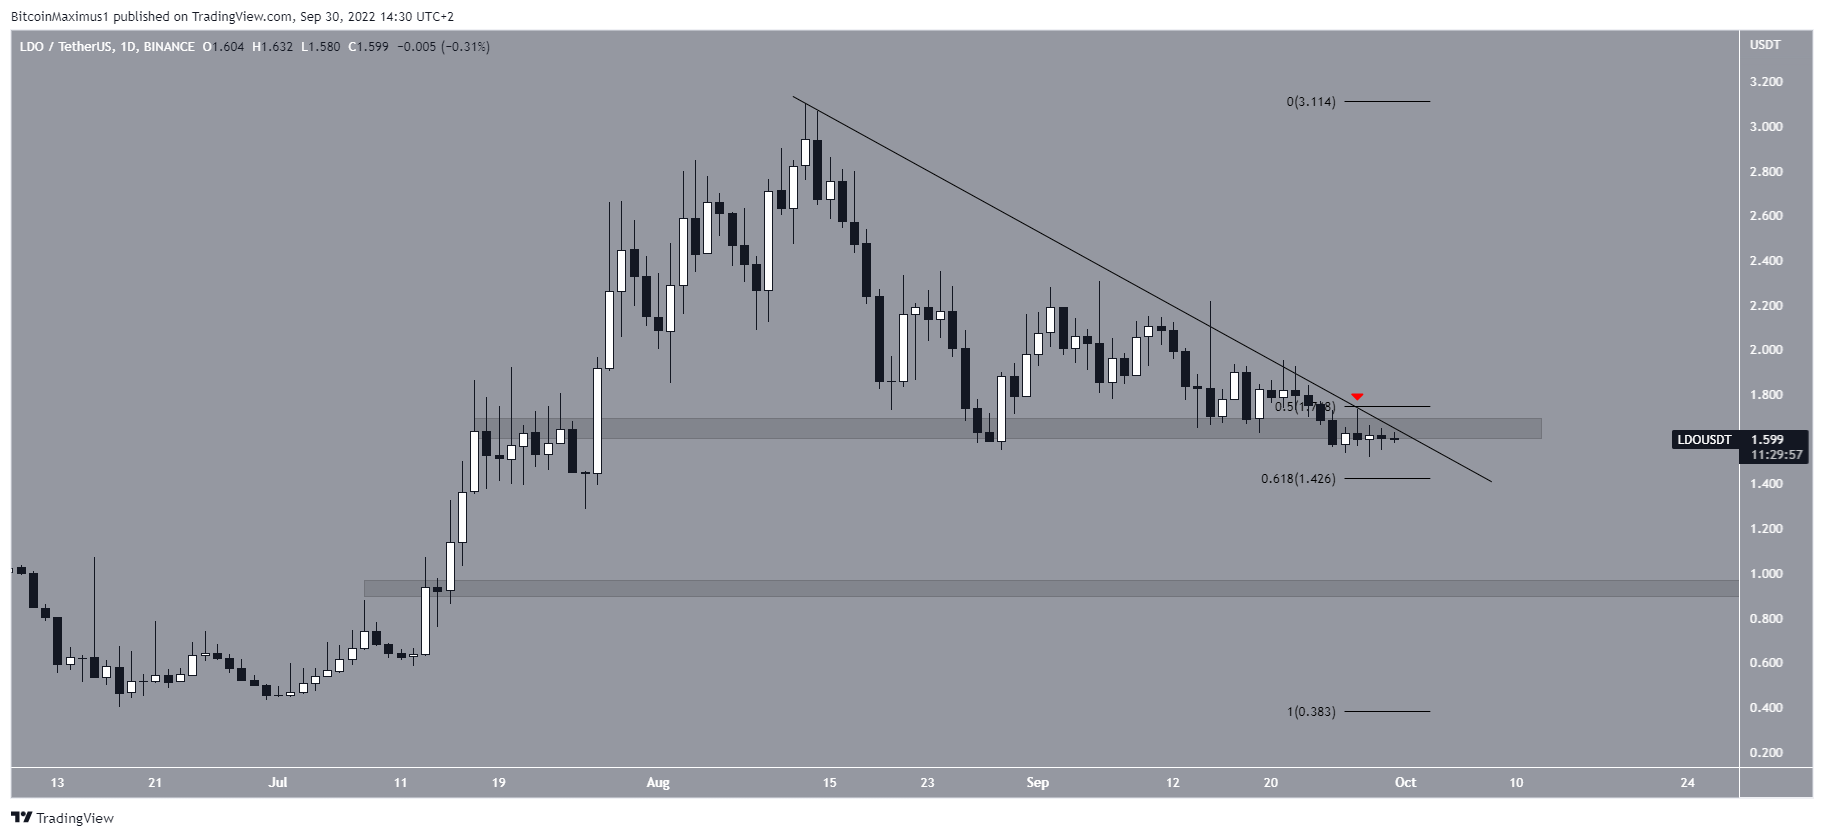
LDO faces major breakdown
LDO has been decreasing underneath a descending resistance line since reaching a high of $3.10 on Aug. 13. The downward movement has caused LDO to fall to the $1.60 horizontal support level.
Currently, the price is in the process of breaking down from this area (red icon). If so, there would be support at $1.42, created by the 0.618 Fib retracement support level.
If the price fails to bounce at the 0.618 Fib retracement support level, the next support would be all the way down at $0.92.
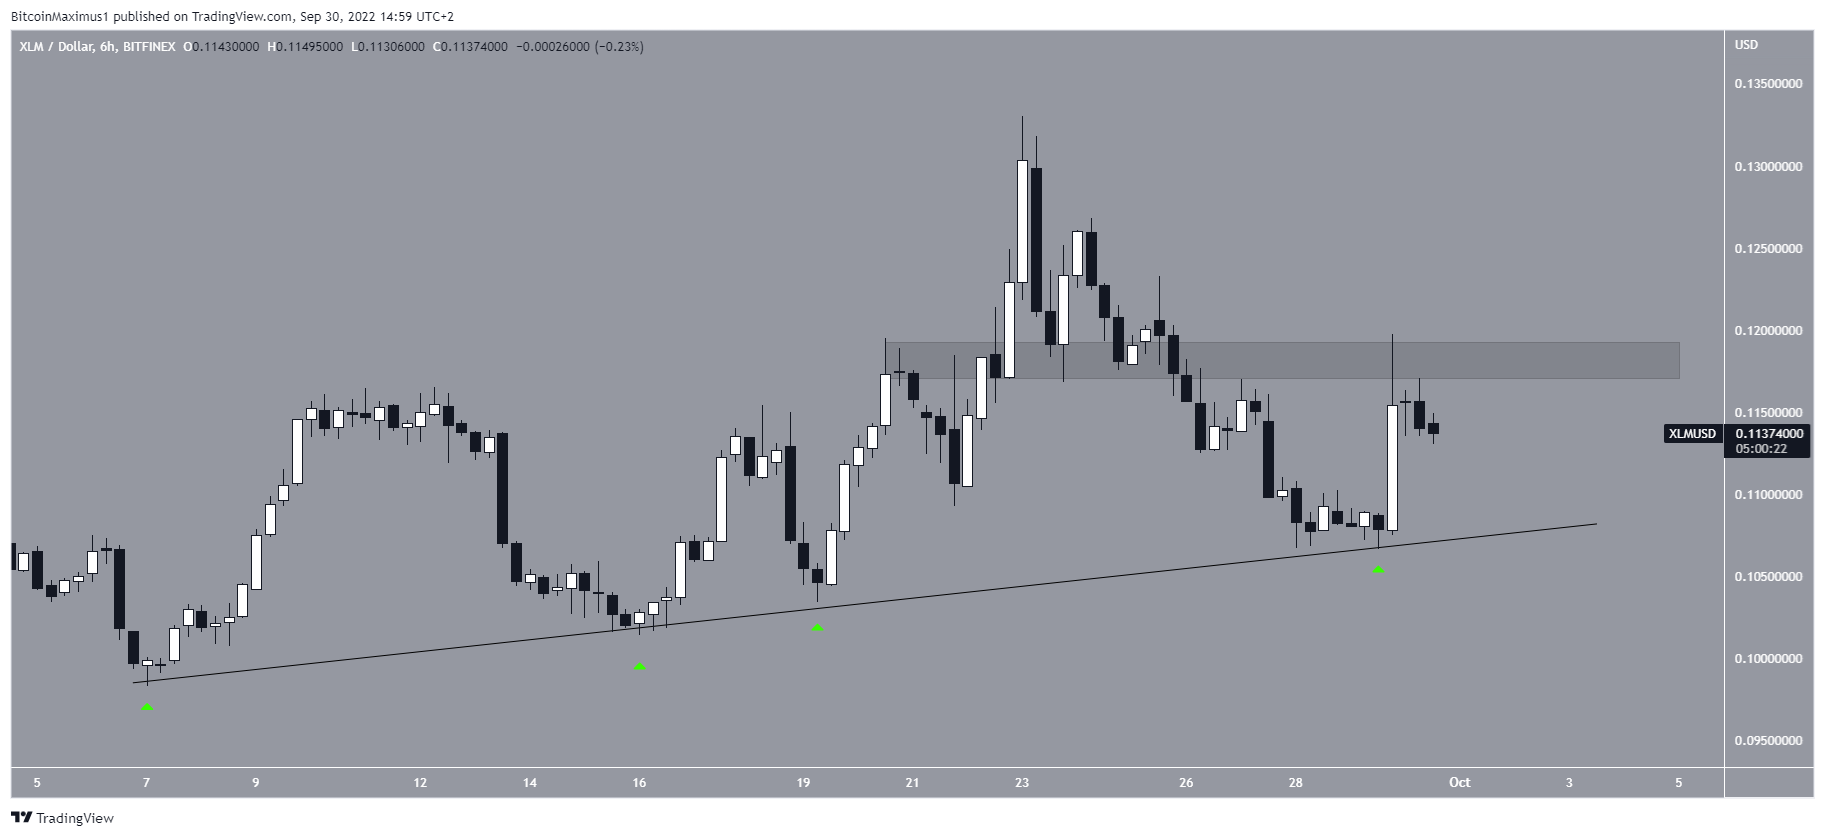
XLM bounces at support line
XLM has been increasing alongside an ascending support line since Sept. 6. So far, the line has been validated four times (green icons), most recently on Sept. 22. XLM initiated an upward movement afterward but failed to move above the $0.118 resistance area.
Whether the price breaks down from the support line or moves above the $0.118 area will likely determine the direction of the future trend.
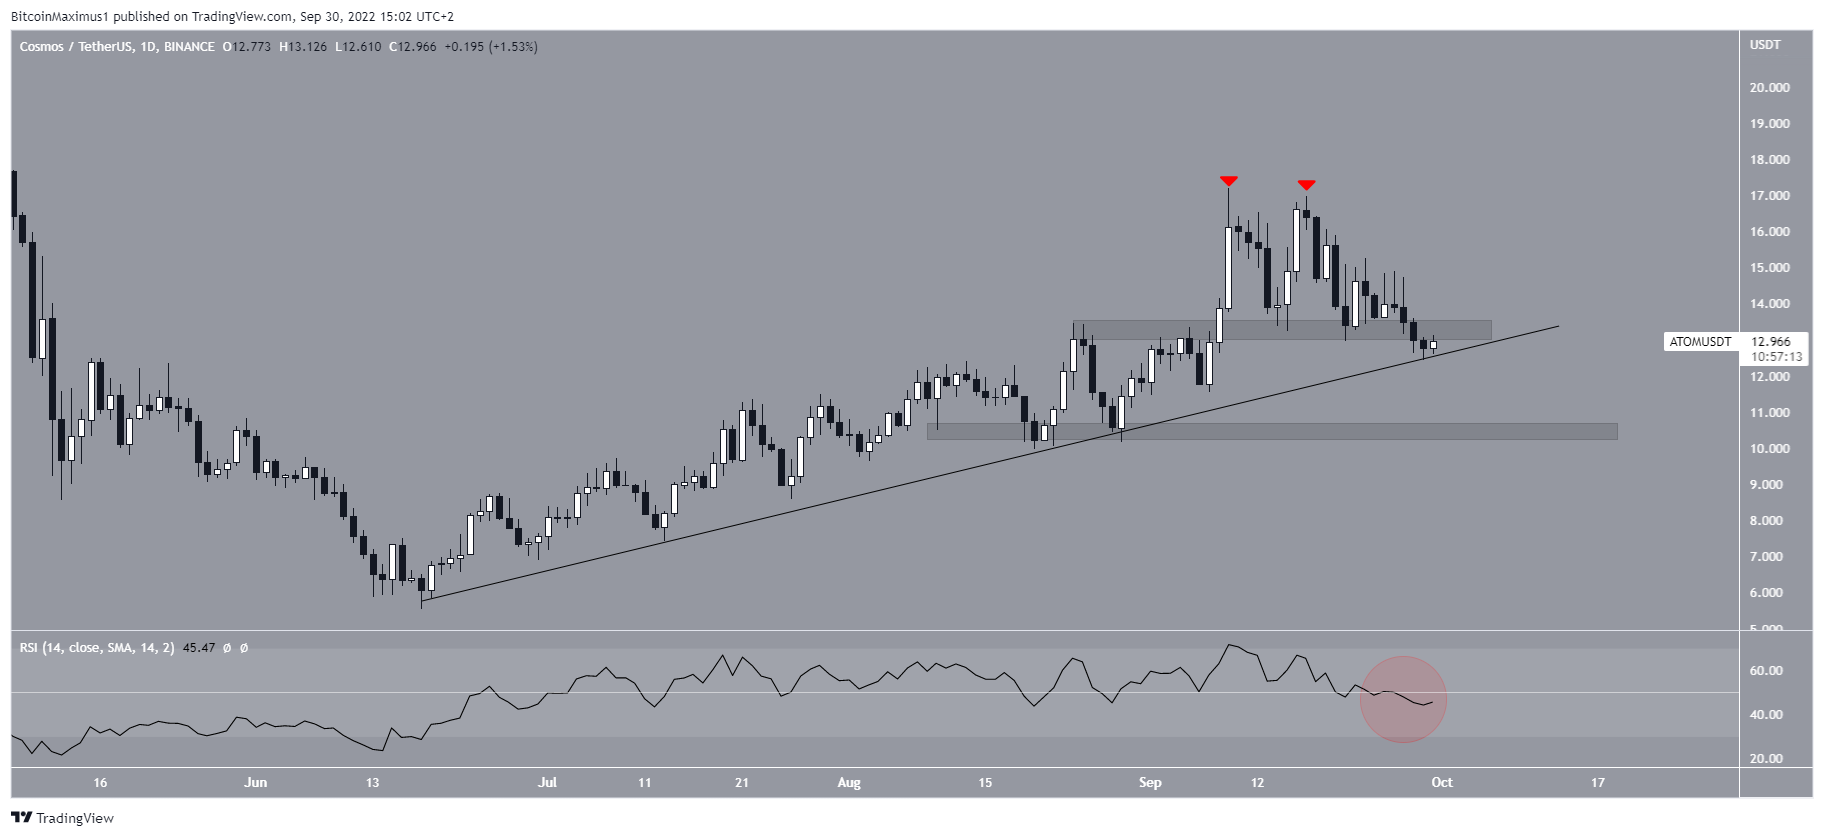
ATOM looks increasingly bearish
ATOM has been falling since creating a double top pattern (red icons) on Sept. 9 and 17. The downward movement has caused a breakdown from the $13.50 horizontal support area. It took ATOM to an ascending support line that has been in place since the June lows.
The daily RSI has fallen below 50 (red circle), a sign of a bearish trend. This indicates that a breakdown from the line could occur. If one occurs, the next closest support area would be at $10.30.
For Be[in]Crypto’s latest Bitcoin (BTC) analysis, click here
Disclaimer
BeInCrypto strives to provide accurate and up-to-date information, but it will not be responsible for any missing facts or inaccurate information. You comply and understand that you should use any of this information at your own risk. Cryptocurrencies are highly volatile financial assets, so research and make your own financial decisions.